Average Golfer Scoring Statistics
Dr. L.J. Riccio, PhD did an analysis of "average golfers."
Although much is known about the statistical profile of professional golfers, little has been published on the play of other golfers. Riccio's 1990 paper used data from over 100 golfers ranging in ability from Jack Nicklaus to a 35 handicapper.
The analysis was designed to determine which aspects of play separates the average players from the top amateurs. I've also done an analysis of PGA Tour Tournament results from 2007. Scroll down to view. He found that some specific statistics were good predictors of score.
For example, the number of pars made could be used to accurately predict score, using the equation, SCORE = 102.6 - 2.7 X #pars. If a player typically makes 7 pars each round, his/her likely average score would be 102.6 - 2.7 X 7 = 83.7. Take a look at how many pars you usually make in a round (analyze your last 5 rounds). What does the above formula predict for your average score? Is it a good predictor? Another good predictor is greens in regulation, GIR. The formula Riccio discovered for GIR is SCORE = 95.1 - 2.0 X GIR. If you are an excellent ball striker and happen to hit on average 15 greens per round, then your likely average score would be 95.1 - 2.0 X 15 = 65.1. Yes, 65! The pros don't hit on average 15 greens per round..
Below is a table which summarizes some of the statistics that Riccio investigated. Where do you fit in with your game?
AVERAGE
SCORE |
Relationship |
|||||||||
| CATEGORY | 71 |
75 |
79 |
81 |
85 |
89 |
91 |
95 |
99 |
|
| GIR | 12 |
10 |
8 |
7 |
5 |
3 |
2 |
0 |
0 |
Strong |
| % Fairways | 81 |
71 |
61 |
56 |
46 |
36 |
31 |
21 |
11 |
Weak |
| Iron Accuracy | 80 |
68 |
53 |
47 |
33 |
20 |
13 |
0 |
0 |
Good |
| Putts per Round | 29.0 |
30.3 |
31.7 |
32.3 |
33.7 |
35.0 |
35.7 |
37.0 |
38.3 |
Weak |
| Pitch/Chip/Sand | 5.1 |
7.4 |
9.8 |
10.9 |
13.3 |
15.6 |
16.8 |
19.2 |
21.5 |
Strong |
| Birdies | 3.2 |
2.4 |
1.8 |
1.5 |
0.8 |
0.1 |
0 |
0 |
0 |
Strong |
| Pars | 11.8 |
10.3 |
8.8 |
8.1 |
6.6 |
5.1 |
4.3 |
2.8 |
1.3 |
Strong |
The last column indicates the strength of the statistical relationship between score and the statistic. A "Strong" relationship is one that predicts quite well one statisitic given the other (i.e. the SCORE given the GIR). A "Weak" relationship does not predict as well.
Let's say your scoring average is 89. You have a goal to get down to breaking 80, thus a scoring average of 79. Compared to overall average golfer statistics, you need to improve by:
† increasing GIR from 3 to 8 (267% increase)
† increasing Iron Accuracy from 20 to 53% (265% increase)
† reducing Putts per Round from 35.0 to 31.7 (9.5% decrease)
† reducing Pitch/Chip/Sand from 15.6 to 9.8 (37% decrease
Your ball striking and thus swing would need to improve immensely to reach your goal. Imagine how much less improvement is necessary with the short game to realize lower scores. I recommend you buying Dave Pelz's book to help out.
I've also done my own statistical study on amateur golfer statistics. Using a similar range of handicaps as Riccio, I've analyzed scores from my own golf club's tournaments. Click on this link, Fair Handicap Analysis.
From www.usga.org , they have a listing of Men's Handicap Indexes and percentages in each category. Even though this would not include all golfers, it's a pretty good representative sample. 70% of men have indices between 7 and 23, corresponding to scores of about 77 to 93, with an average of 85 (assuming a course rating of about 70).
PGA Tour 2007 Analysis -- GIR, Score and Fairway Accuracy
I'm a subscriber to TourCast that's sponsored by the PGA Tour. I use it to collect statistics of Tour players. I'm most interested in overall tournament statistics. I recently looked at the Nissan Open (Riviera in LA) and AT&T Pebble Beach tournaments. I focused on Par 4 holes. I found that scoring average hole is signficantly lower when players hit their second shots from the fairway. Below is a graph of Score versus Overall GIR.
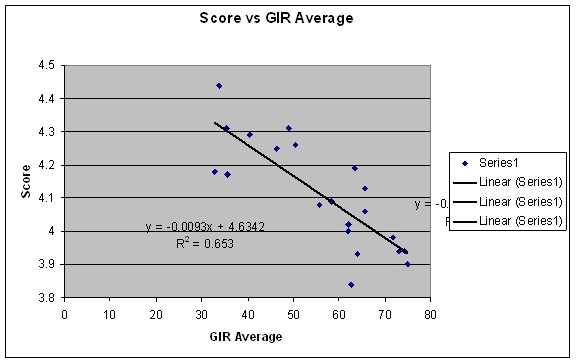
Over the rounds of both tournaments, the average GIR when players hit the fairway was 61% while when hitting from the rough, it was 44%. From the graph above, a 61% GIR yields an average score of about 4.06 and a 44% GIR yields an average score of 4.22. That's 0.16 strokes per holes. Courses usually have about 10 - 12 par fours.
For a course with 12 par fours, hitting from the rough would add 12 X 0.16 = 1.92 stokes to a round. An average of 1.92 strokes per round more on the PGA Tour is HUGE!!
On the 2006 Tour, that's the difference between being #1 ($9.9 Million) and #13 ($2.6 Million) OR the difference between being #20 ($2.6 Million) and #182($1.0 Million). Amateurs hit fewer fairways than do pros which would mean the cost is even greater than 1.92 strokes per round.
And, amateurs are less able to hit decent shots from the rough so there would be an even great differences For amateurs, especially, it's much more important to hit the fairway than to hit it long.
Try a little experiment. For five rounds or so, instead of hitting a Driver off the tee, hit a fairway wood or hybrid and keep track of how many fairways you hit and how many greens you hit. With the greater loft, you'll hit fewer errant shots and find more fairways.
The goal of the game is to shoot the lowest score, isn't it???
