Newsletter -- Odds of a Hole-in-One
You may have heard theat Rickie Folwer made a Hole-in-One playing in the Els for Autism Foundation pro-am that resulted in a $1 Million donation in support of autism awareness. What were the odds of this happening?
To date on the PGA Tour this season, there have been 14 Hole-in-Ones up to The Honda Classic. How many more will there likely be?
In the year 2000, Golf Digest hired Fancis Scheid, PhD., the retired chairman of the mathematics department at Boston University, to calculate the odds using the latest and best information available. Shceid came up with a 3 000 to 1 chance of a PGA Tour making an ace while that of a low handicapper to be 5 000 to 1. The average golfer odds are about 12 000 to 1.
I couldn't seem to find any specifics about the method or data used by Scheid to do his calculations (if you know of them, please let me know at probablegolf@yahoo.ca). So, I decided to do my own calculation. The data is available for the PGA Tour for various years.
In 2015, there were 42 Hole-in-Ones on the PGA Tour. To calculate the odds, one needs to know how many attempts were made (how many shots were hit on Par 3s). According to PGA Tour stats, there were 75 176 Par 3 attempts, so the percentage of Hole-in-Ones would be 0.0559% or 1790 to 1 odds.
As a comparision, in 2013, there were 30 Hole-in-Ones with 64 842 attempts so the percentage was 0.0463% or 2160 to 1 odds.
At first glance, it seems there are more Hole-in-Ones on the PGA Tour now than there were 16 years ago when Dr. Scheid did his analysis.
I'll analyze some other years and report them in my next newsletter. Because of the luck involved (the right bounces), Hole-in-Ones are very random, therefore it's not surprising to find variability between years. PGA Tour players have the greatest chance because they hit the ball close to the hole most often. I'll also take a look at differences in Par 3 yardages.
Here's a chart of the number of PGA Tour Hole-in-Ones for the past 45 years. The trend suggests that on average, there has been an increase which either means there has been an increase in the number of rounds played OR "these guys are good."

In the meantime, here are some other interesting Hole-in-One statistics. Have you had a Hole-in-One? Have you had more than one? I've had 3 in my 40 year career of playing golf, but I haven't had one now for 25 years.

Newsletter -- Rory & Tiger Natural Putting Tempo
You can review my previous newsletter on this topic by clicking HERE.
I've been advocating a putting stroke that is resonant, meaning that it has a natural tempo dependent on the length of the putter-arm triangle and on the mass distribution within that triangle.
Today, we'll look at two putting strokes in the context of being natually resonant. We'll look at the putting strokes of Rory McIlroy and Tiger Woods.
I would argue that neither Rory nor Tiger were specifically "taught" to putt the way they do. They both evolved their own putting strokes through trial and error. As you'll see, their putting strokes are markedly different yet both achieve the same results; great putting.

Above is an image of Rory's stroke just before impact. The image is from a video shot at 300 frames per second. I used the video to create still images and measured the motion of the putter head. Below is a graph of his putter speed (in cm/s) vs time (in milliseconds, ms). One ms is one thousandth of a second.

The blue points represent the values I measured from the still photos of the video. The black curve represents a smoothed average of the points. Each of the blue points has a certain degree of measuring uncertainty, thus it's best to think of the motion as the black curve.
Since you may not be versed in reading motion graphs like the one above, let me explain.
At time 0 ms the putter is at rest but begins to move backwards with negative velocity. The putter reaches a peak backwards velocity of about -100 cm/s just before 300 ms, afterwhich it slows to zero at about 460 ms (end of backstroke). The putter then accelerates in a forward direction and reaches its peak velocity (impact) of 260 cm/s at 700 ms. Rory's backstroke to downstroke tempo ratio is therefore 460 ms to 240 ms OR 1.9 to 1.
Likewise, an image of Tiger just before impact is below.

And below is a graph of Tiger's putter velocity vs time.

Note that Tiger's maximum backward velocity is about -75 cm/s and occurs at about 400 ms. He completes his backstroke at 550 ms and achieves impact at 790 ms with a speed of about 210 cm/s. His backstroke to downstroke tempo ratio is therefore 550 ms to 240 ms OR 2.3 to 1.
Note that in comparing Rory's putting velocity curve to Tiger's, they are very similar in shape. Note some distinct differences, however:
- Tiger's maximum backstroke velocity is lower (length as well) but the same impact velocity is obtained meaning greater acceleration on the forward stroke.
- Tiger's maximum forward putter speed is about 2.8 times faster than his maximum backward putter speed, while Rory's is 2 times faster.
- Tiger's tempo ratio is 2.3 to 1 while Rory's is 1.9 to 1.
And when you compare their two strokes to a naturally swinging compound pendulum like the one in the diagram below, there are some significant differences. The velocity graph below has velocity in m/s and time in seconds (recall that 1 second = 1000 milliseconds).
GOLF TIP: The average golfer will lose about 2 yards of carry on their Driver for every 10 degree F drop in temperature and a little less for a 9-iron. When playing in significantly cooler temperatures, you need to hit at least a half club more. Plus, tee shots won't carry as far because of less roll, so you'll have longer shots into the green, Click HERE.
 |
 |
Note the symmetry of the Velocity graph for a natural compound pendulum. The maximum backward velocity is the same as the maximum forward velocity (about 1.8 m/s). Quite different than Rory and Tiger's. It's obvious that both Rory and Tiger exert a force on their forward stroke resulting in higher acceleration and thus greater impact speed.
Tempo Timing Devices
In my last newsletter, I recommended some nice metronome apps you can download to your phone, or you can buy a small, clip on metronome at your sports shop or music shop (they are used for running and playing music). Ping and other golf companies also provide apps for phones. You can get a cradle to hold your phone while attached to the shaft of your putter.
Or, a much more expensive alterative would be an Apple watch.
You've probably heard of the theory that it takes about 10 000 repetitions to master a motor skill, such as a putting stroke. To master your natural tempo, ideally that would mean stroking 10 000 putts. But tempo can be practiced without a ball. As long as you have your metronome app or clip on metronome and your putter, you can practice your stroke and master your tempo sooner.
More on discovering your ideal natural tempo in my next newsletter.
In the meantime, check out my past newsletter topics by clicking HERE.
Playing in the Wind & Cool Temperatures
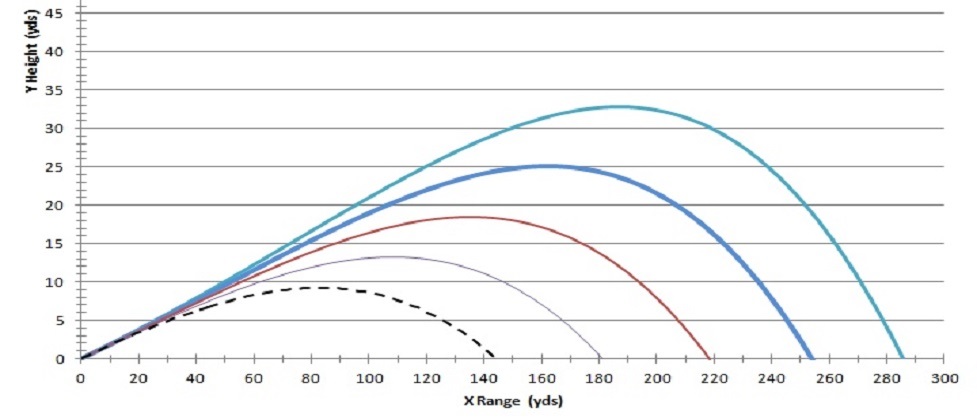
Even the best players in the world have a tough time with the wind and cool temperatures. Lots of adjusting needs to occur (the least of which is staying warm). Wind speed is hard to read and wind gusting makes it tough to predict the effect on the golf ball, and to commit to the shot.
As a recent example, look at the scores in the recent Farmer's Insurance Open at Tory Pines won by Brandt Snedeker. The average scores in the four rounds were 70.3, 70.4, 73.2 and 77.9. And the weekend scores didn't include the poorer players (those that missed the cut). The last round in particular had very windy conditions and it was cool. The wind really makes it difficult for all of us, even the pros.
I provide three services to golfers who are interested in determining how the wind will affect their shots.
1. How to Read and Play the Wind -- based on average launch trajectoriesYou'll learn how to measure the speed and direction of the wind and then calculate how far the shot will play. Only $15.99 |
|
2. Club Ranges for Head Wind and Tail Wind -- based on average launch trajectoriesSend me your normal club ranges. I'll convert them into the ranges your clubs will play into headwinds and tailwinds. Only $24.99. |
|
3.Your Unique Club Ranges for Head Wind and Tail Wind -- based on your own launch trajectoriesSend me your normal club ranges along with your launch angles and spin. I'll convert them into the ranges your clubs will play into headwinds and tailwinds. Only $44.99. You'll need to have access to a launch monitor such as Trackman, Flightscope. |
You can immediately download a copy "Reading & Playing the Wind." I'll explain how you can easily measure the wind's speed (without using any kind of electronic device) and how much each 1 yard per second of wind will affect your various club ranges. The only guessing for you will be determining if the wind's speed is in fact constant.
The report will include how to compensate for crosswinds and partial crosswinds. It'll take much of the guesswork out of picking the right club for the shot.
You can order and download immediately by clicking on the PayPal icon below.
| Remember, it's highly unlikely you'll ever hit a good shot if you are doubting what club to hit. Using my wind tips, you'll be able to quantify the number of yards the wind will likely affect your shot. As your confidence grows with you being able to predict the effect, the more committed you will become to your shots, the better you'll hit them, and the lower you will score. |
The cost of the report is only $15.99. ORDER Here.
Unless the wind is blowing really hard, you don't need to change your swing; you just need to change your club. You need to choose the right club and have confidence in hitting it. My tips will make this a reality.
You can provide me with yardages for each club in your bag. I'll input your values into a program I have written, and send you a template which will outline how different speed winds will change the real yardages for each club. The service is only $15.99. You can order it here.
See and order all or my products at my golf product order (click HERE) page.
