|
|
Probablility of Shot Patterns
Golf statistics, specifically
those related to a player's shot patterns can be very revealing
and useful. PGA Tour Professionals would benefit the most from knowing
their shot patterns since they are the most consistent ball strikers.
If you would like an analysis of
your shot pattern, you can send me some of your round statistics (5 to 10 Rounds),
I'll analyze it and send you back a report. Just download an Excel
Spreadsheet using the link, Download
Excel Round, and e-mail me your results.
Identifying
and understanding your shot patterns can help you make
smarter decisions on the golf course. When should you aim at the
pin and
when should you aim at a different part of the green? Club selection
is
crucial: it all depends on your shot pattern. The mathematics of
golf can
calculate probabilities for hitting each club. This page explains
the golf
tip that will enable you to shoot a lower score by improving your
club
selection.
Consider a shot to a pin which is tucked front/left on the par 3, 17th hole which is 158 yards long. A water hazard guards the front portion of the green. You are one down in your match and hitting first. Should you aim at the pin? Probably not but it does depend on your shot pattern. If you land your selected iron within 15 feet of the pin 95% of the time, then the odds are in your favour. But even Tiger Woods isn't that consistently accurate. It's more likely that you hit at least 60% of your shots left and short meaning that if you aim at the pin, you are likely to go in the water and lose your match. It would be better to aim right and a little long. If you hit it where you aim, you'll still have a putt for birdie. If you do what is likely and hit it left and short, you'll be closer to the pin. Club Shot Pattern Test : In 2003, Golf Digest performed some tests involved hitting a series of shots on 12 iron models introduced recently. Golf Digest Chief Technical Advisor Frank Thomas designed the test.
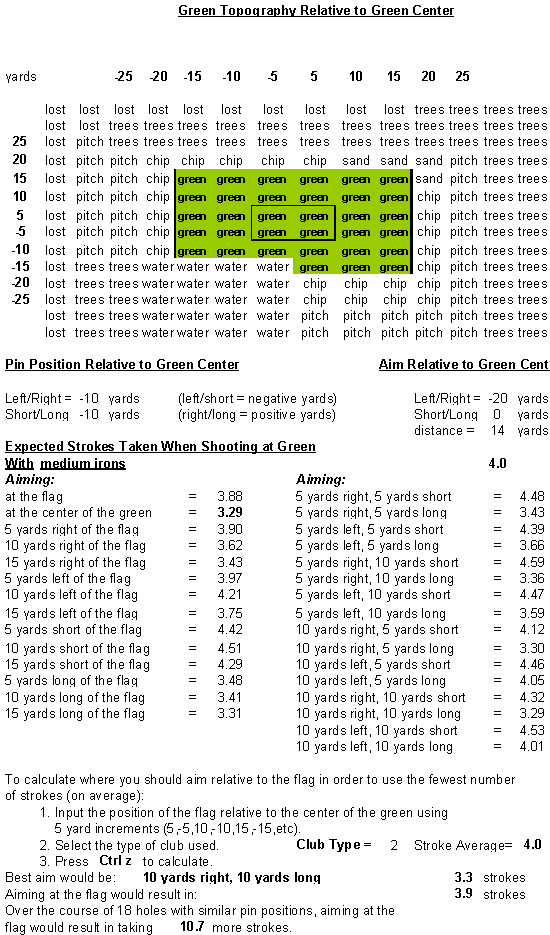
By determining your own unique shot pattern, you can more accurately club for your shots and get better results. Why club to hit into the "red zone" above if you're only able to execute 5% of the time? Below are my statistics for the last 20 rounds with medium irons 5 through 7. Close is considered within 5 yards of the pin. Note that 30% of my shots finish short and 29% finish left. Notice that my entire shot pattern is documented. In each rectangle is recorded the number of irons hit to that area (yellow) and the percentage of irons hit to that area.  Below is a mapping of the green to which I have been referring. One can determine which part of the green to aim at by calculating the various outcomes of aiming at each part of the green. The region which yields the lowest score is the best choice. For instance, aiming at the pin is likely to result in penalties and extra strokes due to water. Aiming at the right side of the green is likely to result in a three putt.
All of the possibilities can be taken into account. The results are listed below.  Note that in the above the aim is 10 yards left and 10 yards short of the middle of the green. Aiming at the flag would most often result in a score of 3.88 strokes while aiming 10 yards right and 10 yards long would result in a score of 3.29, over half a stroke more. Aiming at the flag on all 18 holes (assuming similar pin placements and hazards) would increase your score by 10.7 strokes!! Note that the highest score would be made if the aim were 10 yards short and 10 yards left of the pin. For a specific example of how the calculations are done, click here to few them in one of the issues of my newsletter. The key to applying your shot pattern to your game is discipline. Applying your shot pattern to determine your aim on each shot will guarantee (based on the probabilities) your lowest average score day in and day out. Of course, we have all gone against the odds on occasion and won, but most times we suffer the consequences of playing risky shots.
If you'd like to see how one would calculate
the likely, average score on a
I provide a service to golfers who are interested
in determining their shot patterns. If you'd like to try this
service for free, I'm offering a free trial. Download an Excel
Worksheet that you can complete and send back to me for analysis
(). Click here Download
Excel Round
If you'd like to purchase this service, click Order or you can go to my golf product page, Order Services option. I'll send you the necessary forms so that you can track your statistics for 10 rounds. You'll send me the results, I'll input them into a program I have created and send you a report of your shot patterns and short games statistics. I'll also tell you which part of your game to work on to produce the most significant improvements. The cost of the shot pattern analysis is $39.99. With it, you get all my tips on how to read greens, adjusting for elevation changes and playing the wind, as well as an analysis of up to 20 rounds in a season, afterwhich each 10 rounds would cost $10 for analysis. The shot pattern analysis service alone has a fee of $19.99. Email if you're just interested in it.
Find below the results of my shot patterns
with various clubs.

©Probable Golf Instruction, Ken Tannar 2001-2015. All Rights Reserved. Langley, B.C. V2Y 2G4 CanadaPhone: 604-309-7030 FAX: to fax, email an attachment probablegolf@yahoo.ca or golfexpert@probablegolfinstruction.com |
| GOLF ASSISTANTS |
|
Golf Trip Pairing CalculatorPlanning a golf trip with some friends/family? Trying to sort out the foursomes so people don't play too often with others? Order your ready made Spreadsheet. Type in the names, print out the groupings. Minimize repeat pairings.
Wind Caddy will advise you on aim, distance and club so that you can play the wind successfully. It takes the guess work out of club selection. New option to enter custom distances for each club. The algorithm will make a club suggestion accordingly. Use the right club in every condition!
|
|
|
| GOLF NEWS |
Golf Putting Green Reading Glasses |
| GOLF NEWSLETTER |
Statistics
·Putting
·Longest Golf Balls
·Games
·Handicap
·Scoring
·Shot Patterns
·Tournaments
·PGA Tour Stats
Pro Shop
·Ball Marker Engraved
·Books
·CDs & DVDs
·Green Reader
·Impact Labels
·Laser Rangefinder
·Longer Drives
·Products
·Teaching Aids
|
|
| GOLF POLL |
The 19th Hole
·Advertising
·Ask the Golf Expert
·Consultation/Litigation
·FAQs
·Golf Blog
·Golf Draws
·Links
·Science of Golf
·Tell a Friend
·Testimonials
·

Golf Ball Finder Glasses
Find all your errant golf balls and many more!
| GOLF TIPS |
How to play:
|


