November 24 /08
Click on any of the following Newsletter topics or just scroll down the page:
Less Length & More Loft = More Distance & Accuracy
Inconsistency on PGA Tour = Higher Earnings
Wedge System for 100 yards and In
Peak Performance on U-tube -- How to go Low!
Lofts for Wedges -- Gap Distance
Less Length & More Loft
Deb Vangellow and Nabori Santiago conducted a study of recreational women golfers, aged 36-59 and handicaps 16-30. They had the women hit their driving clubs and then hit other driving clubs with more and less loft as well as more and less length. The study has been published in Science and Golf V, Proceedings of the World Scientific Congress of Golf.
The results of the testing indicated increased launch angle and distance when the women hit drivers with more loft and less length. Increased club speed and ball speed resulted from hitting a shorter length club. Contact became more centered and solid as evident with the impact tape used. As well, the women seemed to positively alter the motion of the their swings through improved balance and steady finish position.
Equipment |
Clubhead Speed |
Ball Speed |
Launch Angle |
Distance |
Usual Driver |
54 |
80 |
18 |
141 |
Added Loft |
59 |
80 |
16 |
152 |
Decreased Loft |
57 |
79 |
13 |
138 |
Increased Length |
58 |
79 |
20 |
146 |
Decreased Length |
62 |
83 |
14 |
162 |
*speeds in mph and distance in yards
Previous research has shown that higher loft is important for golfers across the board and that shorter length is important. The combination of loft and length appears to be especially beneficial and rewarding for the female recreational golfer seeking to gain greater distance and increased accuracy.
Hitting drivers with too little loft as a profound effect on the athlestic motion or the balance a person can obtain during a golf swing. Too little loft will have the golfer going through a variety of manipulations to get the ball airborne with a desired trajectory. Many female golfers cite being able to hit their fairway woods farther than their drivers.
This study supports the mounting evidence that increased length does not produce significantly more club head speed and distance. The loft of the club is so much more important, thus the concept of equal length irons that I promote. Learn more about these revolutionary clubs HERE.
Inconsistency on PGA Tour = More Earnings
A few years back, I did an analysis of scores on the PGA Tour to determine if shooting even par week in and week out would enable the player to survive. Was par a good enough score? What I discovered was that par was an excellent score. Shooting even par each round would enable to player to make many cuts and place about 20th in earnings. You can read the full report here.
What I had assumed in the analysis a few years ago was that the player shoots even par each and every round that he plays. This, of course, is highly unlikely. Players' scores vary between their best scores to their worst scores. In statistical analysis, we measure that variability by a measure called standard deviation. The standard deviation is a measure of how much the values differ from the average (or mean). In the analysis a few years ago, I assumed the average score to be even par and the standard deviation to be zero, which means no variability in scoring at all (each and every round was an even par score).
It's much more realistic to analyze PGA Tour scores based on not only the average score but also the variablility of the scores (standard deviation). So, I performed a new analysis of scores, this time using 2008 scoring. The purpose of the analysis was to determine if a player's earnings would increase or decrease if he lowered his average score and/or lowered his standard deviation (variability of scoring). This is what I did:
1. I chose a player from the 2008 season whose earnings ranked around 30th.
2. I entered all of his scores for the season into a spreadsheet and calculate his mean score (average) and standard deviation.
3. I selected one tournament from each month of the season and inputted the scores and earnings for each final position of those tournaments. The purses of these tournaments were about $6 Million.
4. I had the computer randomly generate scores for the player based on the mean and standard deviation for the current season, and then matched up the scores with the various tournaments and earnings for placing in those tournaments.
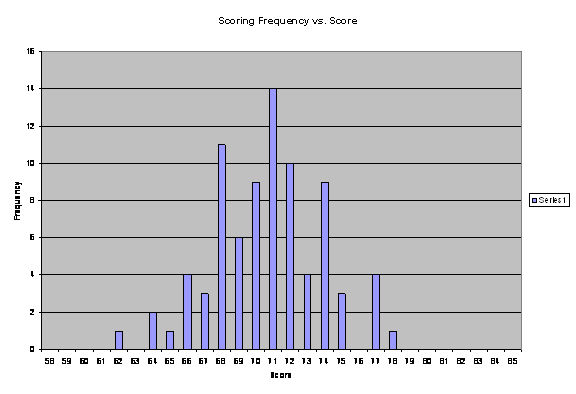
The range of freqencies of the player is plotted in the graph below. Note that the player's scores ranged from a low of 62 to a high of 78. The most common score was 71, which occurred 14 times. The mean (average) of these scores is 70.7 and standard deviation is 3.2. A standard deviation of 3.2 means that 68% of the scores are within 3.2 strokes of the mean (3.2 less and 3.2 more; between 67.5 and 73.9) and 95% of the scores are within 6.4 strokes of the mean (between 64.3 and 77.1).
5. I had the computer randomly generate scores and match up earnings to simulate the player playing in over 400 tournaments and then averaged the results to reflect how much the player would earn in one season, based on how many tournaments he played in 2008.
6. I then changed the player's standard deviation so it was one less, 2.2 (instead of 3.2), thus simulating more consistent scoring (66.3 to 75.1) and repeated the simulation. The mean was still 70.7.
7. I then changed the player's standard deviation so it was one more, 4.2 (instead of 32), thus simulating less consistent scoring (62.3-79.1) and repeated the simulation. The mean was still 70.7.
8. I then changed the player's mean score so it was 0.5 strokes less, 70.2 (instead of 70.7), thus simulating a lower average score. The standard deviation was kept at 3.2.
9. I then changed the player's mean score so it was 0.5 strokes more, 71.2 (instead of 70.7), thus simulating a higher average score. The standard deviation was kept at 3.2.
Here are the 2008 earnings the player would have earned based on the 5 simulations.
Normal Scoring |
St Dev -1 |
St Dev +1 |
Mean -0.5 |
Mean +0.5 |
|
$ 7.3 Million |
$ 4.8 Million |
$ 9.5 Million |
$ 10.2 Million |
$ 4.8 Million |
It's very interesting to note that lowering the standard deviation (player becoming more consistent without changing their mean score) results in less earnings while increasing the standard deviation results in more earnings. This is due to the structure of the prizes. The top five prizes in a tournament account for a majority of the total purse, thus a player is rewarded for having higher variability in scoring. The player can have four good rounds in a tournament and win over $200 000 and then miss the cut a number of times and still earn more than a player who makes the cut each time but doesn't have any low scores.
As would be expected, lowering the mean score increases the earnings and raising the mean score decreases the earnings.
It would be interesting to determine if the same results would occur for other positions on the earnings list such as 75th, 125th and 175th. I power up my spreadsheet and do those simulations and report them in later newsletters.
If you have any comments about this simulation, please past them onto me at probablegolf@yahoo.ca.
I've arranged a free trial of the software for my members. Plus, Probable Golf Members receive over 40% off the regular subscription price.
Free Trial for Probable Golf Members
Wedge System for 100 yards and In
For shots within 100 yards, most golfers need to make partial swings. I've come up with a fairly simple system that will help you with your distance control. Have a shot of 60 yards? Do you need a 1/3 swing or a 1/2 swing? How much should you choke down on the club?
My system outlines exactly what you need to do? Find out more here.
Peak Performance -- How to Go Low
I subscribe to Dr. Cohn's free Sports Psychology newsletter, Sports Insights. He has a lot of great tips on golf's mental game. He talks a lot about the pre-shot routine and remaining focused. In his latest, he described how many golfers will have a great, if not career, front name, only to falter on the back nine. The reason? They're out of their comfort zone.
I suggest you go to his site and sign up for his free newsletter.
Here's the link: Peak Performance Newsletter Look at the top of the right hand menu.
Once you sign up, come back here and view his latest video.
Click
here to order Dave's Pelz's Short Game Bible, OR get it at your local bookstore. BUT, whatever you do, GET IT !! Your game will love you for it.
Trying to find answers on my website? Here's how.
1. Go to my Frequently Asked Questions (FAQ) page. There's a link to it on my pages from the left hand menu near the top of the page, just below the Search icon. It's called "FAQs." You then click on the graphic icon and you'll be taken to my database page. For your convenience, here it is:
FAQ
I've answered hundreds of questions over the past 6 years and have created a fairly large database. You can search it out. If you can't find the answer you're looking for, submit a question and I'll answer it.
2. On all of my web pages, there is a search feature in the top left section, right underneath my LOGO. Just place your search keywords in the search box, select "This Site" below it, and then press "Search." What will come up is a Google search of the pages on my site with relevance. You can also search the entire internet by selecting "Web" instead.
Go to my main page now: Home or just check the top left menu of this page.
3. Also, directly under the Google Search area, you'll find a pop down menu called "Your Topic." Select the topic of interest and press "Go."
I would suggest you bookmark my main page and/or your specific areas of interest so that you can find them easily in the future. On each page at the very top, there is a link you can click on:
"Click here to add this page to your favourites"
Hope you find all you're looking for.
You can learn more from NEW Titleist Pro-V1 by clicking HERE.
A list of resources that have been used to produce
this newsletter can be found on my web site here.
Hope I provided some useful ways for you to
become better prepared for you best golf season
ever.
Ken Tannar
If
you are interested in receiving a newsletter dedicated
to the ideas of this site, use the form below to
subscribe.
Privacy Statement: We will not
use your mailing address for bulk mailings (spam). We
will send information you have requested only.
Furthermore, the frequency we will deliver the
information will be small (about one email message per
month). We will not pass your email address to third
parties under any circumstances.
|